A single surface for the full data lifecycle.

Sync

100+ connectors. File, DB, API. Connect any source, any format, any speed.
No limits, no headaches — just data on demand.

Model

Drag‑drop joins, aggregations, KPIs. Transform raw data into business-ready assets.
Build logic, KPIs, and insights in minutes, not months.

Govern

Your single source of truth — clean, compliant, and controlled.
Track lineage, enforce quality, and build trust.

Analyse

From question to answer at lightning speed.
Visualise, explore, and uncover insights instantly.

Operate

Orchestrate, schedule, and monitor without the chaos.
Run your data platform like a well-oiled machine.

DataDialog

Talk to your data in plain language.
Get answers, insights, and actions — instantly.

Smart Data Forms

Create governed forms on top of existing tables or from scratch, so teams can capture business data without falling back to spreadsheets.

Planning

Turn connected data into practical planning models for financial, demand, capacity, production, inventory, and operational decisions.

Choice of Destination

Publish governed data models to Snowflake, BigQuery, Redshift, on-prem databases, or your preferred analytics destination.

See in action

Connect data without creating another bottleneck

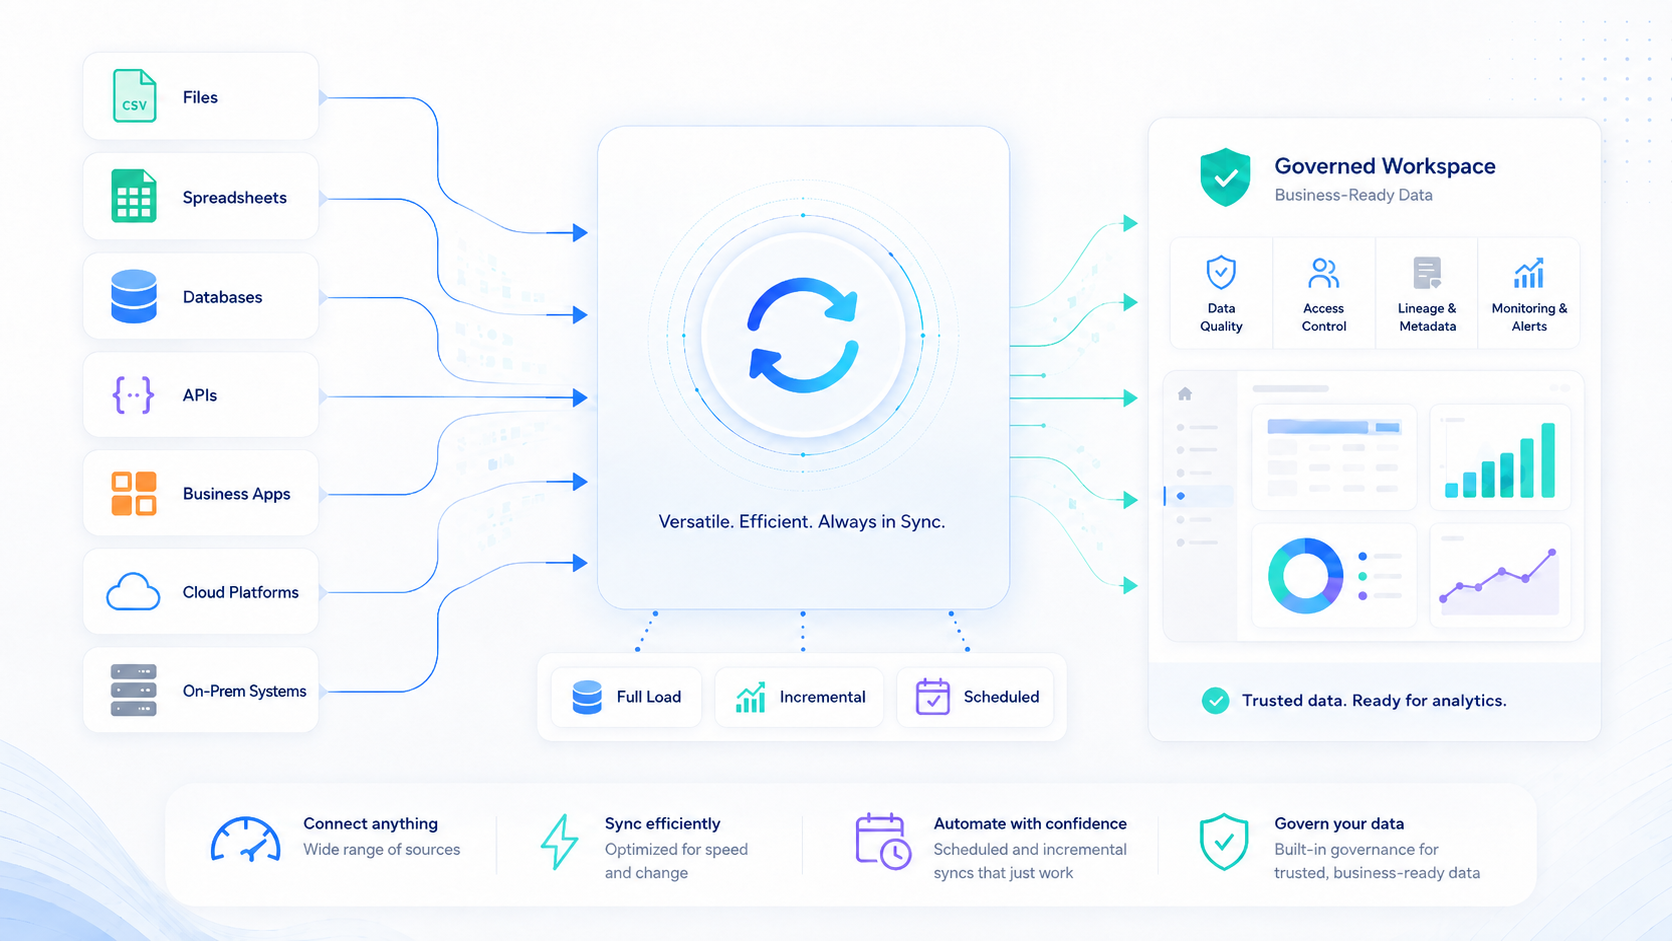
xLytix Sync makes it easier to bring data from multiple sources into a governed platform, using the connection method that fits the source and the business need. From files and spreadsheets to databases, APIs, cloud platforms, and on-prem systems, Sync supports the movement of data into xLytix so teams can start modelling, governing, and analysing faster.

  • Multiple source types: files, databases, APIs, business systems, cloud platforms, and on-prem sources.
  • Multiple sync modes: full load, incremental refresh, scheduled updates, and repeatable data flows.
  • A controlled landing point for data before it moves into modelling and governance.
  • Less dependency on manual extracts, email attachments, and spreadsheet circulation.
  • Faster path from source data to usable business data.
Build business-ready data models with ease

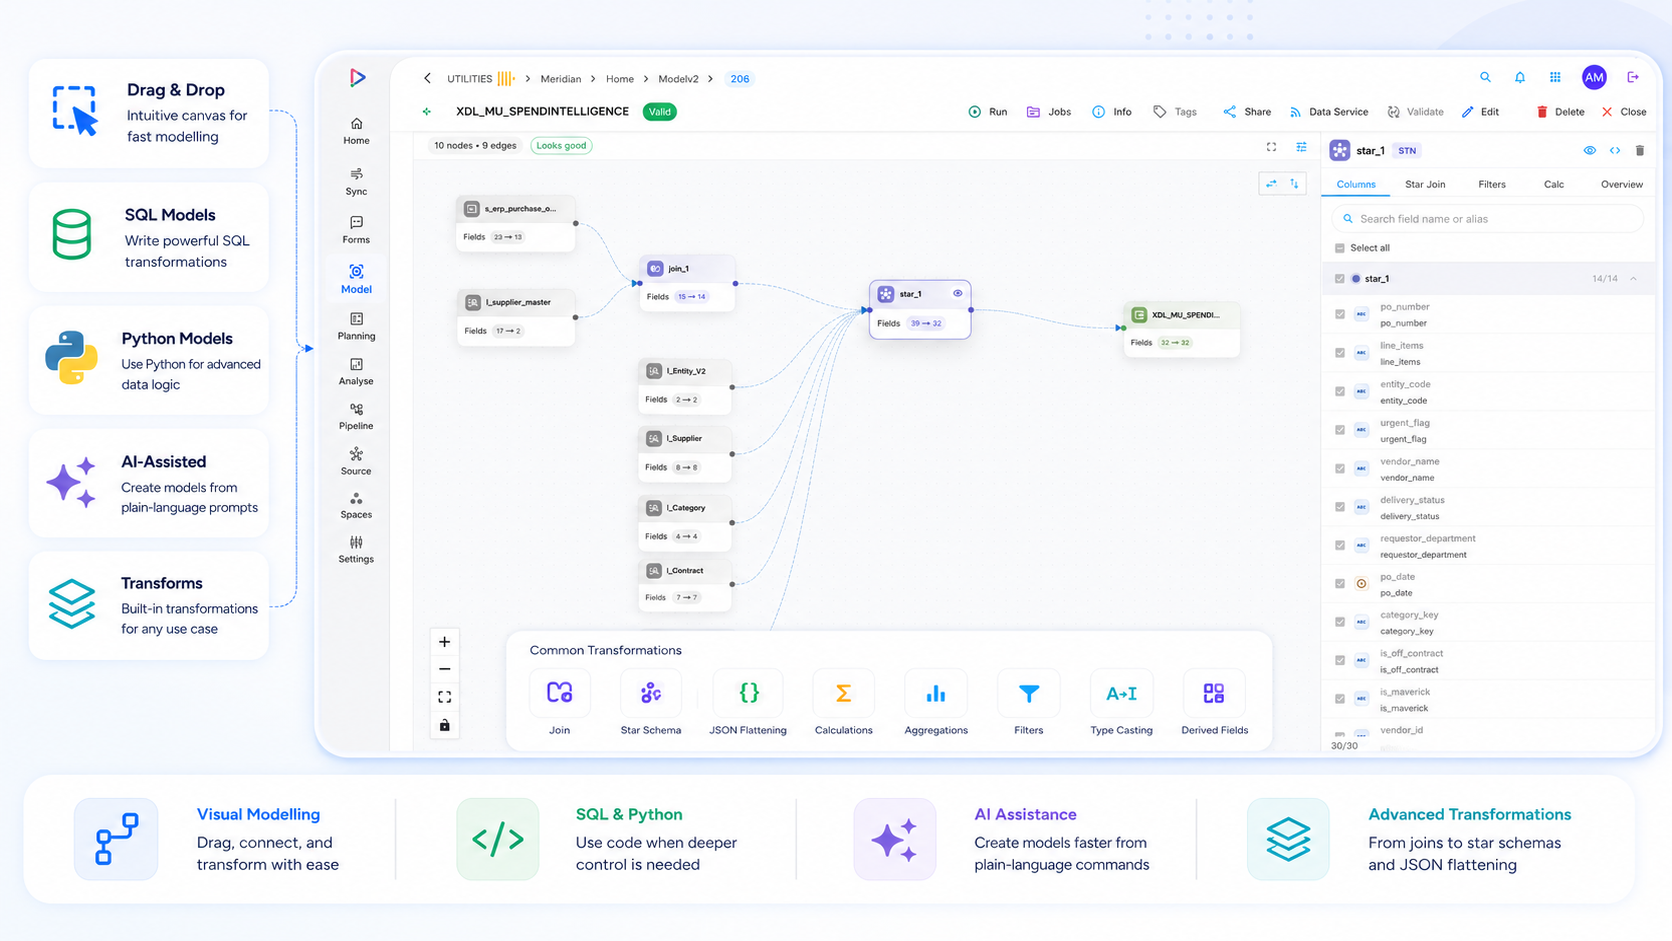
xLytix makes data transformation simple without reducing its power. Teams can create models through a drag-and-drop interface, write SQL for more precise control, or use Python for advanced transformation needs. AI-assisted commands can also help generate models from plain-language instructions, making it faster to move from raw data to usable business logic.

  • Drag and drop fields, joins, filters, calculations, and transformations.
  • Use SQL or Python when the modelling logic needs more flexibility.
  • Create joins, unions, aggregations, derived fields, type casting, lookups, and JSON flattening.
  • Build star schemas, planning models, reporting models, and reusable semantic views.
  • Let AI assist with model creation from natural-language commands.
  • Keep modelling governed, reusable, and connected to downstream analytics.

Path to Data Excellence

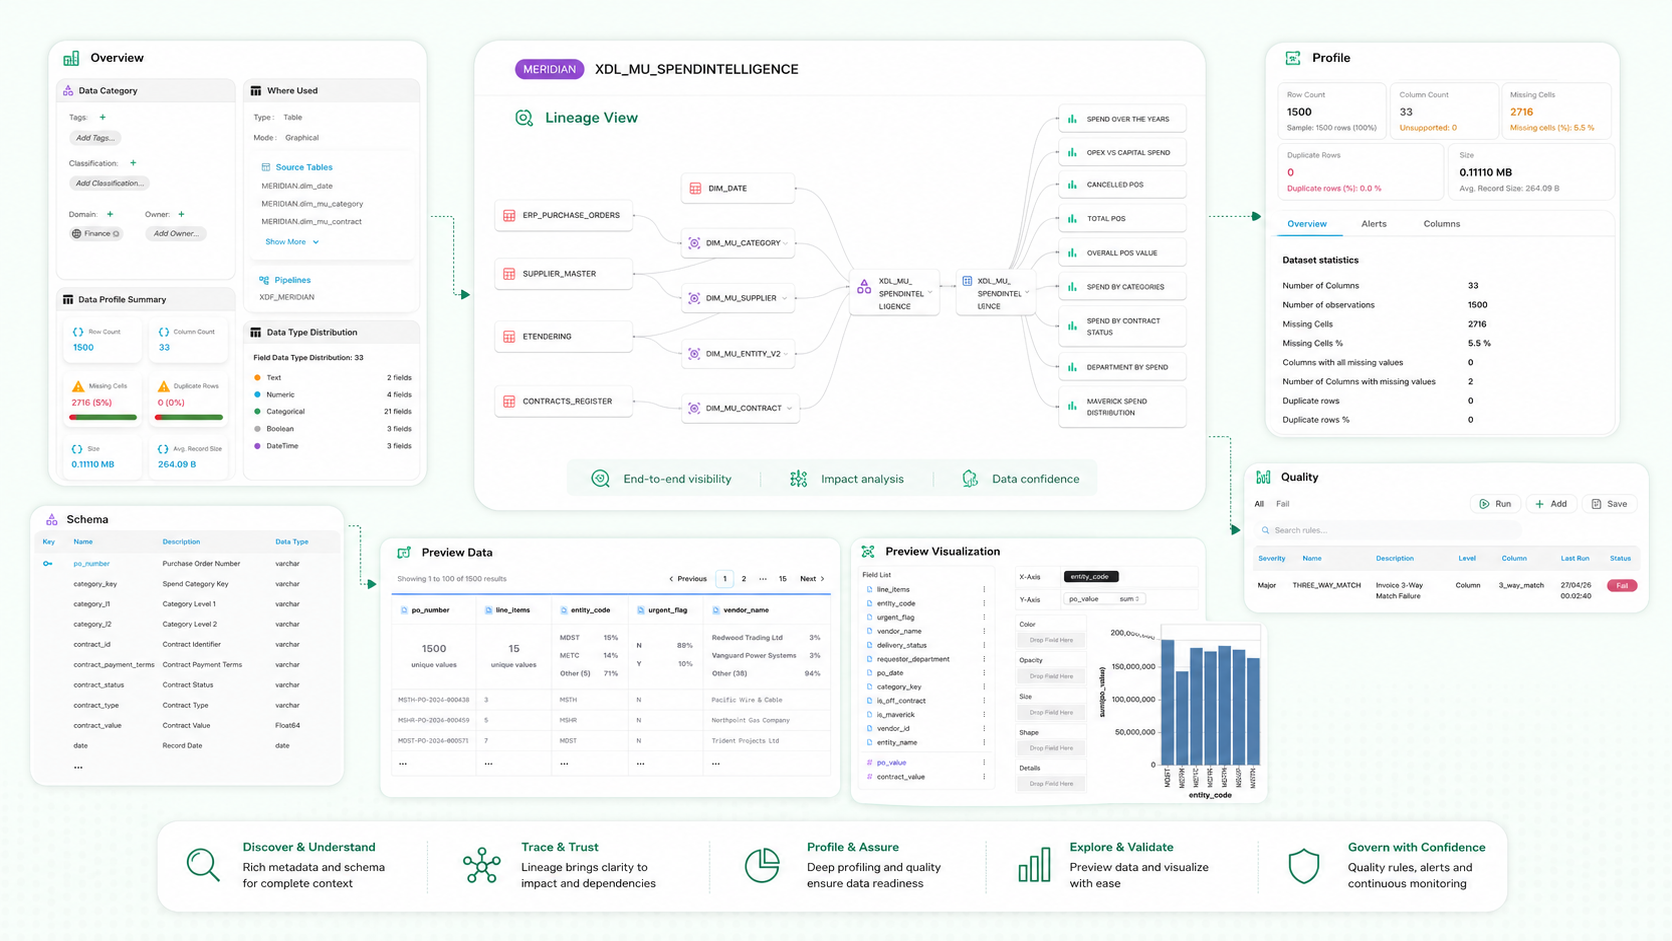
xLytix turns governance into an automatic part of the data journey. Every model, field, calculation, and connection can carry its lineage, quality context, business meaning, and access rules with it, helping teams understand where data came from, how it changed, and whether it can be trusted.

  • Automatic lineage across sources, models, transformations, and analytics.
  • Business glossary, definitions, ownership, and metadata in one place.
  • Data quality checks to highlight missing, inconsistent, duplicate, or unusual data.
  • Access controls and role-based visibility for governed data use.
  • Traceability across fields, joins, calculations, and downstream outputs.
  • Audit-ready context for reporting, planning, and decision-making.
  • A trusted data foundation for AI, DataDialog, and business analysis.

Streamlining Information Flow

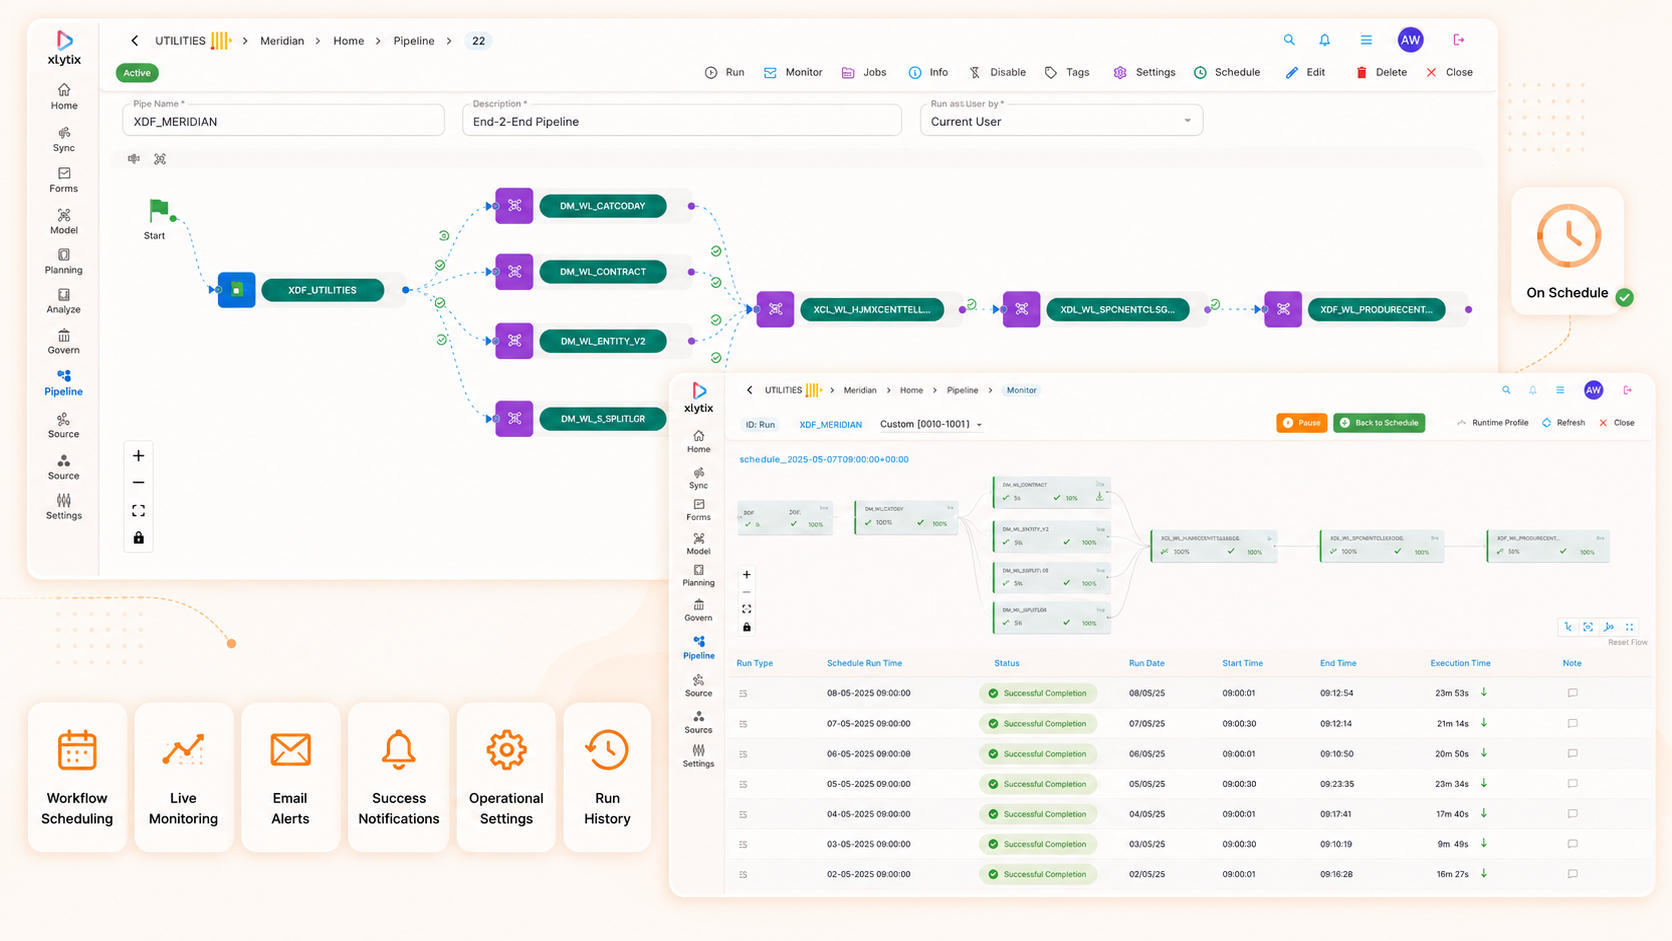
xLytix Operate keeps data workflows moving without constant manual supervision. Teams can schedule loads, monitor execution progress, configure workflow settings, and receive alerts when something succeeds, fails, or needs attention. It gives organisations a simple operational layer for keeping data refreshed, reliable, and ready for use.

  • Create scheduled workflows for recurring data refreshes and loads.
  • Monitor job progress, status, duration, and execution history.
  • Configure alerts for success, failure, delays, and exceptions.
  • Send email notifications to the right users or teams.
  • Manage workflow settings from a single operational view.
  • Reduce dependency on manual checks, reminders, and script-level monitoring.
  • Keep governed data flowing into models, reports, planning, and AI-powered analysis.

Turn Business Inputs into Governed Data

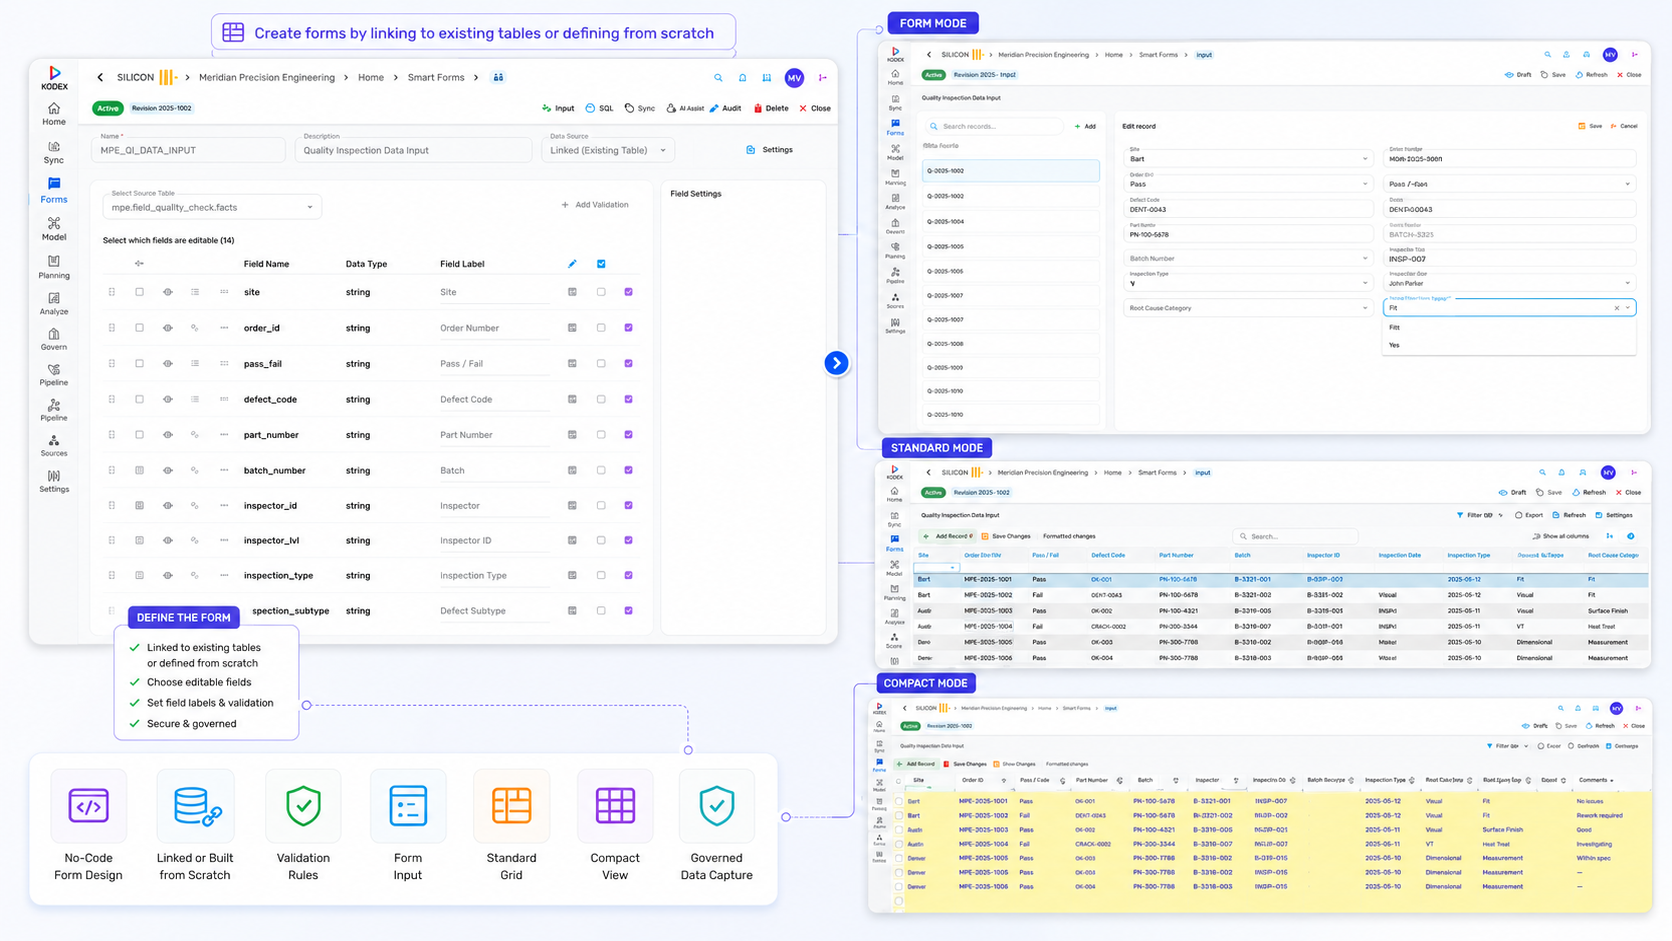
xLytix Smart Data Forms make it easy for teams to capture business inputs through no-code forms instead of uncontrolled spreadsheets. Forms can be created from existing tables or built from scratch, helping organisations collect structured data, validate entries, and make that information immediately available for modelling, planning, reporting, and workflow automation.

  • Create no-code forms from existing tables or new business requirements.
  • Capture structured inputs for planning, operations, approvals, and exceptions.
  • Reduce dependency on emailed spreadsheets and manual consolidation.
  • Add validation, dropdowns, required fields, and controlled data entry.
  • Store form submissions in governed, reusable data structures.
  • Connect captured inputs to models, dashboards, workflows, and analysis.
  • Give business teams a simple front end while IT keeps control of the data layer.

Plain-Language AI for Governed Business Data

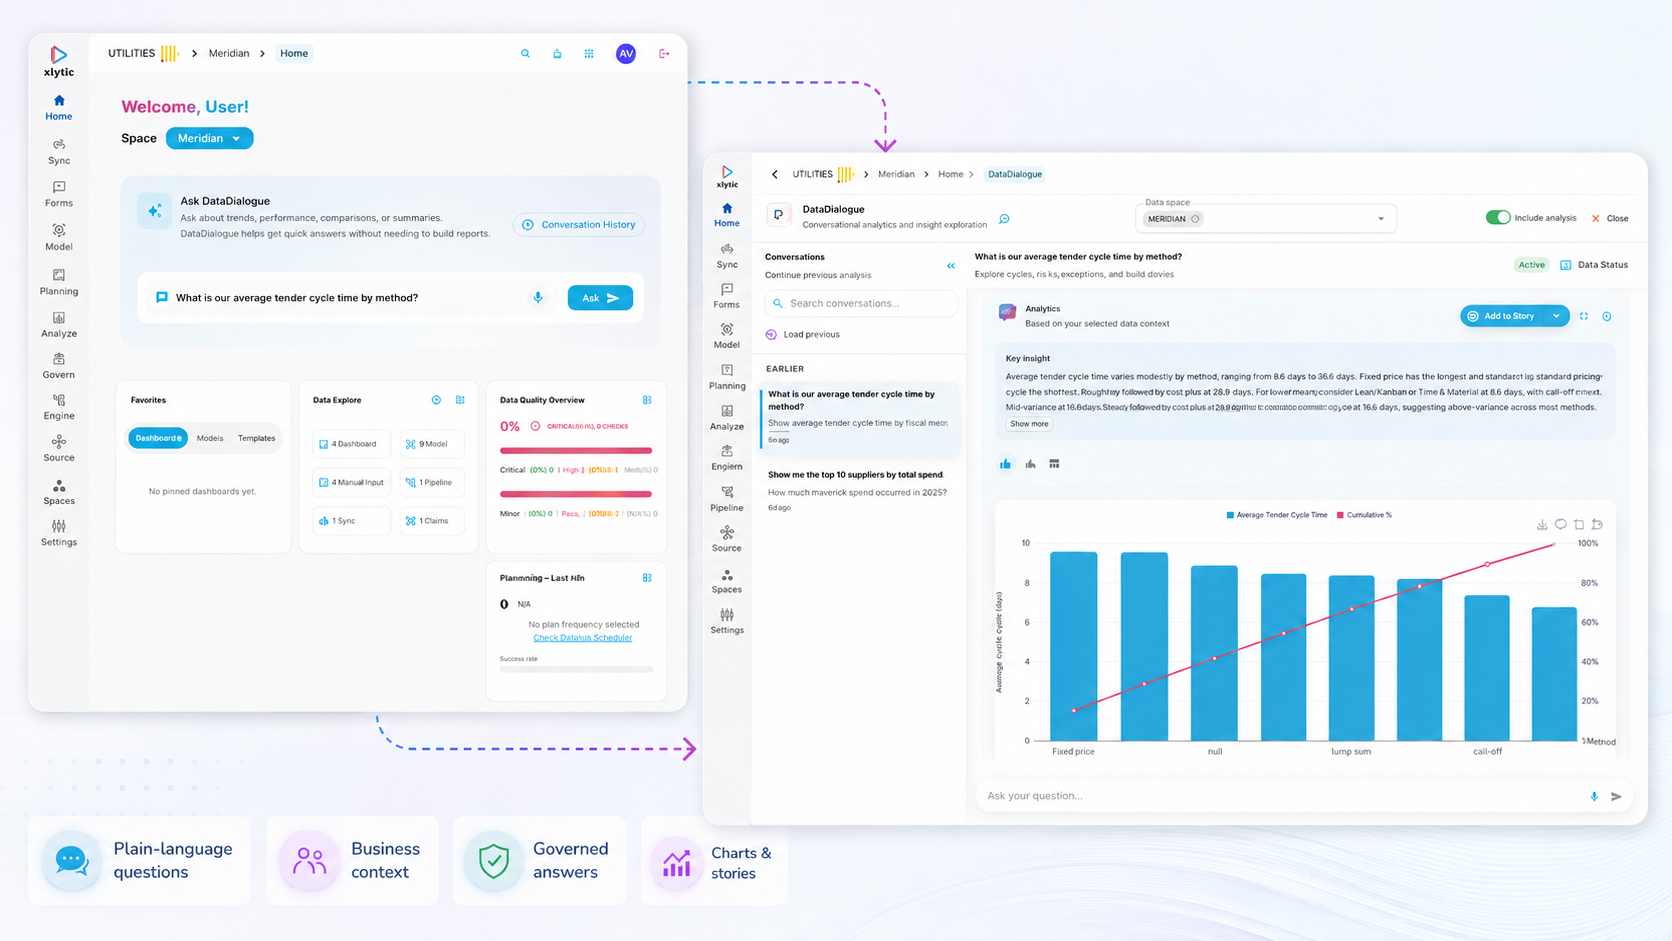
DataDialogue brings AI into the business data layer. Users can ask questions naturally, while xLytix uses governed models, metadata, relationships, and business definitions to understand the context behind the question. The result is not just a generated query, but a more useful path from curiosity to trusted answers.

  • Plain-language questions for business users.
  • AI grounded in governed models and business context.
  • Answers, charts, summaries, and follow-up exploration.
  • Less dependency on predefined reports or technical query writing.
  • Built-in respect for access controls and governed data usage.
  • A practical bridge between business curiosity and trusted analytics.

From Trusted Data to Business Insight

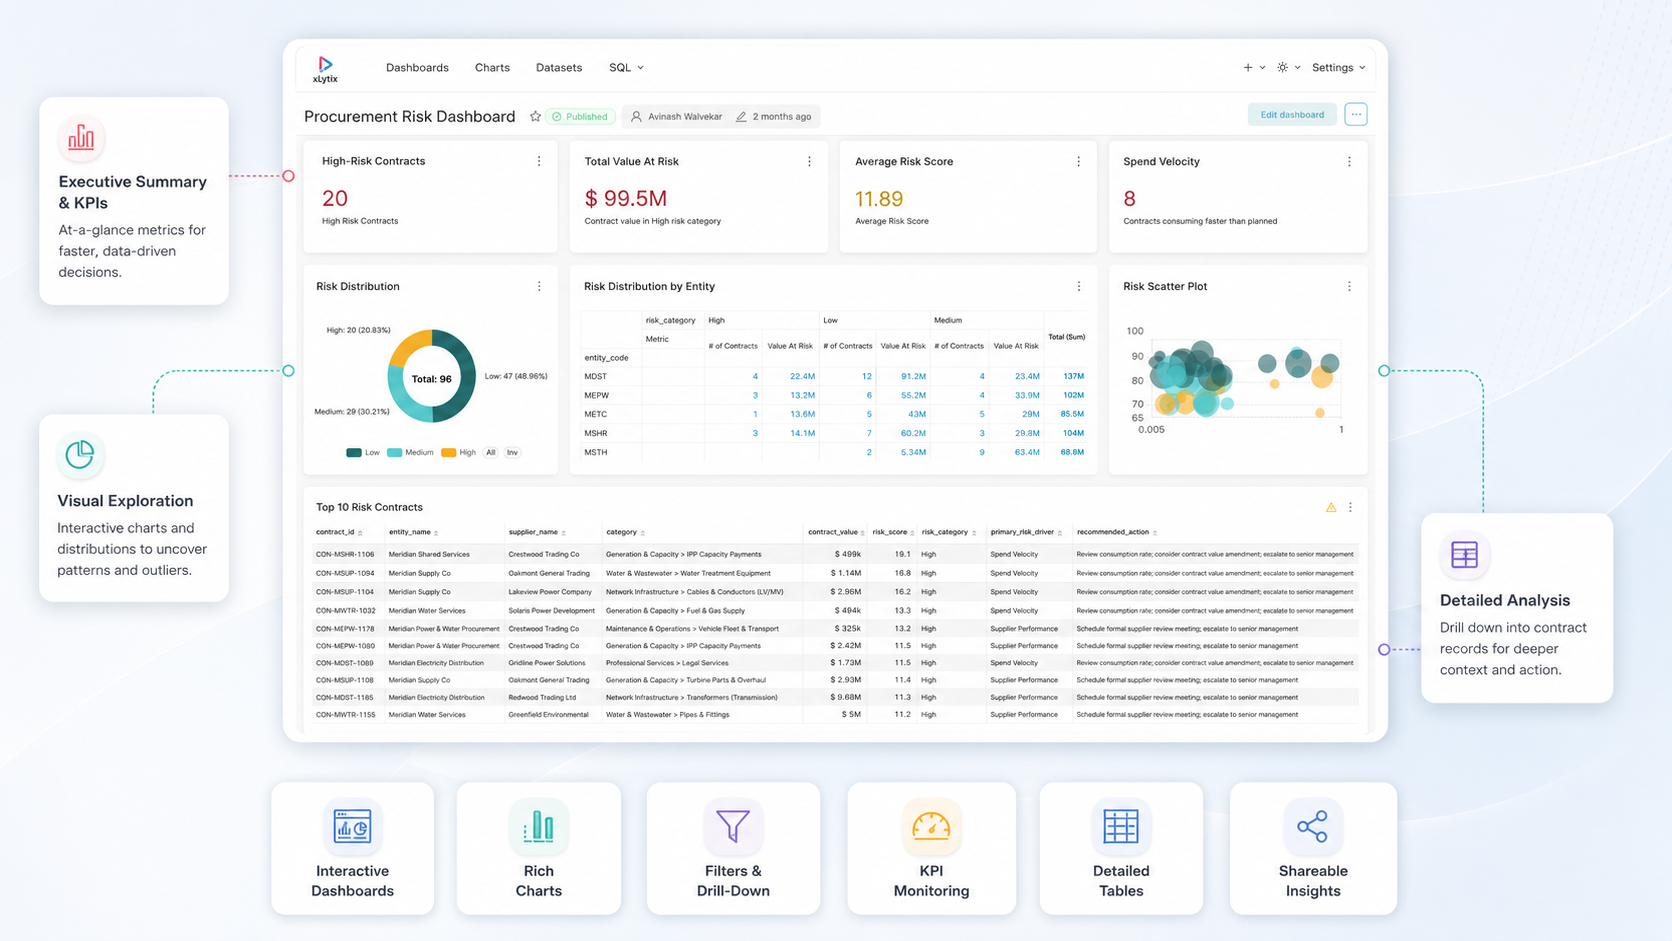
xLytix Analyse gives teams a visual layer for exploring governed data. Users can create dashboards, charts, filters, and interactive views from business-ready datasets, helping them move from static reporting to active exploration. Because analysis sits within the same governed platform, insights remain connected to the models, definitions, lineage, and controls behind the numbers.

  • Create dashboards, charts, and interactive reports.
  • Use rich visual options including tables, pivots, time-series charts, filters, and maps.
  • Explore performance, trends, exceptions, and comparisons.
  • Build reusable views for teams, departments, and management reporting.
  • Drill into governed datasets without losing business context.
  • Keep dashboards connected to lineage, access controls, and trusted model logic.
  • Turn business-ready data into shareable insight faster.
Cookie Consent

Our website uses cookies to ensure you get the best experience on our website.

Learn More